
Type of guideline
Type of guideline
For organisations and individuals involved in Sport for All, evaluation provides answers to critical questions: Are we achieving our goals? Are we reaching the people who need us most? Are we contributing to something bigger, such as the UN’s Sustainable Development Goals (SDGs)? With the right tools, we can gather evidence that tells these stories, validates our efforts, and helps us grow.
Baseline Data – Initial information collected before a program starts to measure changes over time and evaluate its impact.
Demographic Breakdown – A statistical analysis of participants based on factors such as age, gender, identity, and background to assess inclusivity and reach.
Evaluation Metrics – Quantifiable indicators used to assess the effectiveness of a program, such as participation rates, diversity measures, and engagement levels.
Impact Report – A structured document summarizing a program’s goals, key achievements, success stories, challenges, and future plans.
Inclusivity – The practice of ensuring equal access and participation for all individuals, regardless of gender, identity, ability, or background.
Key Performance Indicators (KPIs) – Specific, measurable values used to track progress toward achieving program objectives, such as participant growth or media reach.
Participant Surveys – Questionnaires designed to collect feedback, demographic data, and insights from individuals engaged in a program or event.
Qualitative Insights – Non-numerical data gathered through interviews, stories, or focus groups to understand personal experiences and emotional impact.
Quantitative Data – Numerical information collected through surveys, attendance sheets, or digital analytics to measure program reach and effectiveness.
Sustainability Efforts – Actions taken to minimize environmental impact, promote long-term program viability, and support community well-being.
International Sport Organisations
National Sport Federations
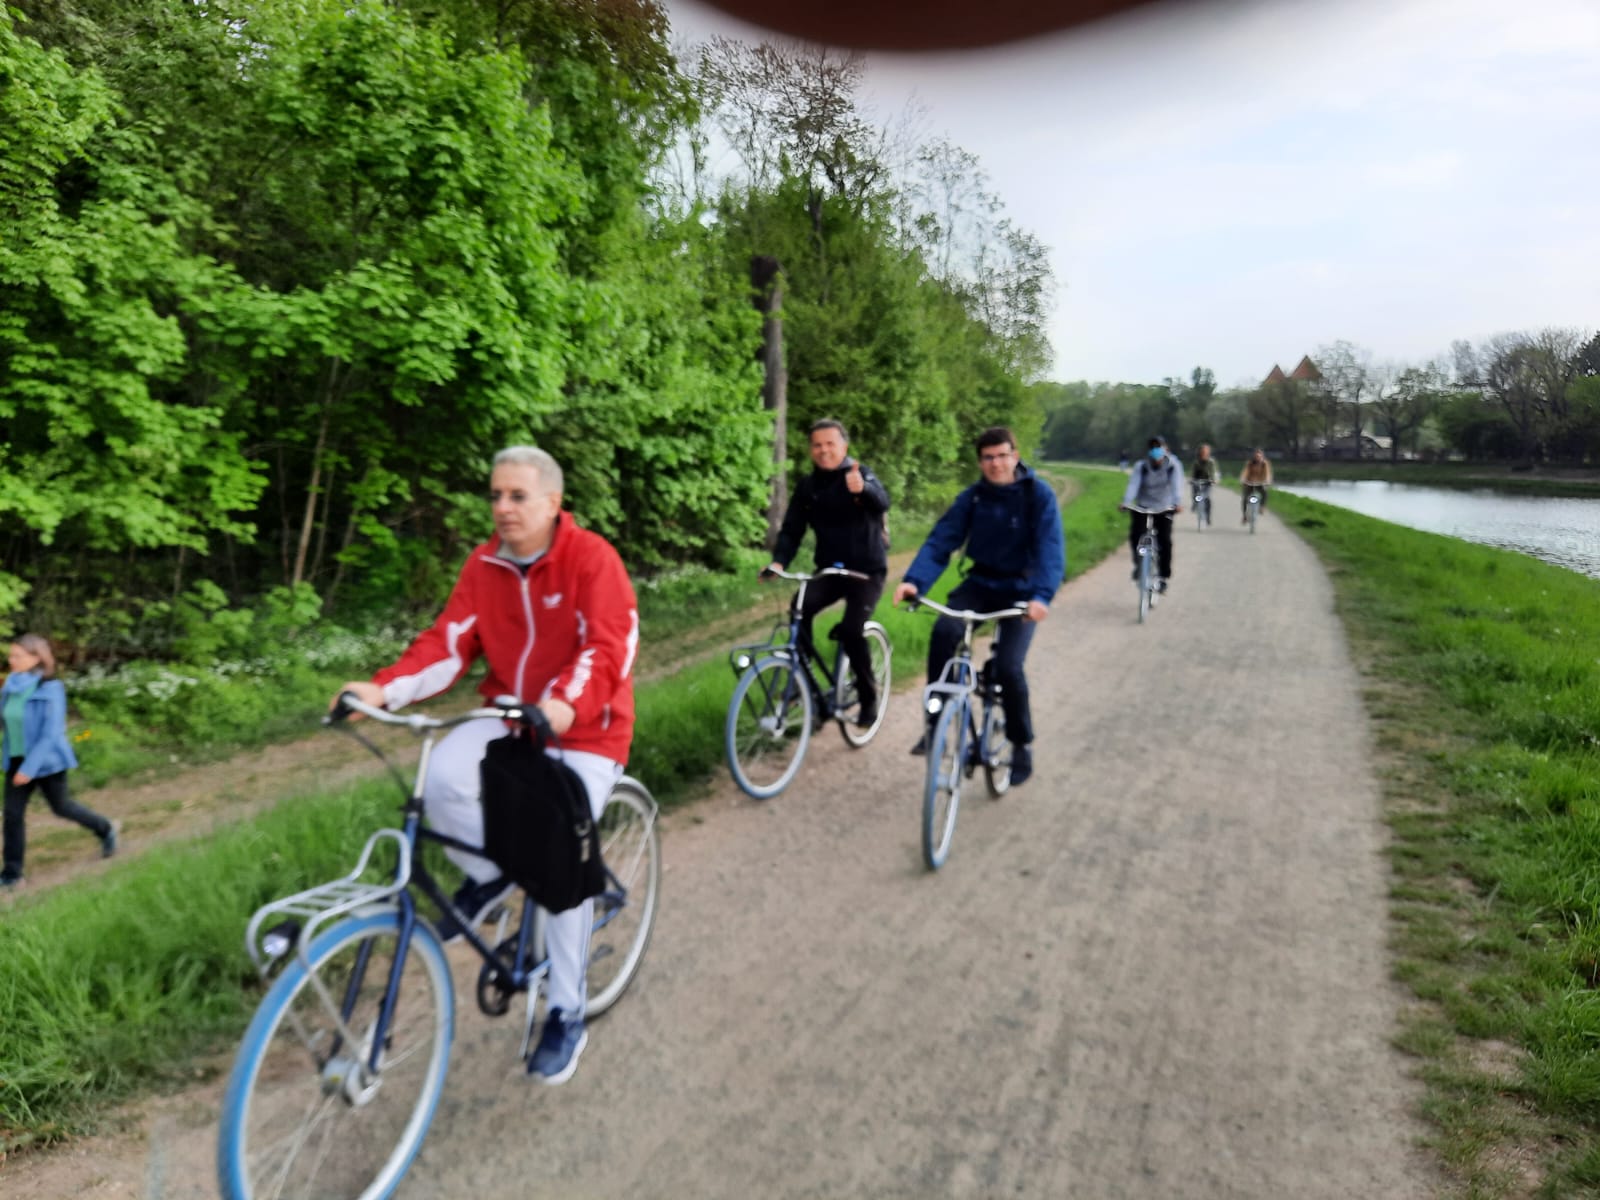
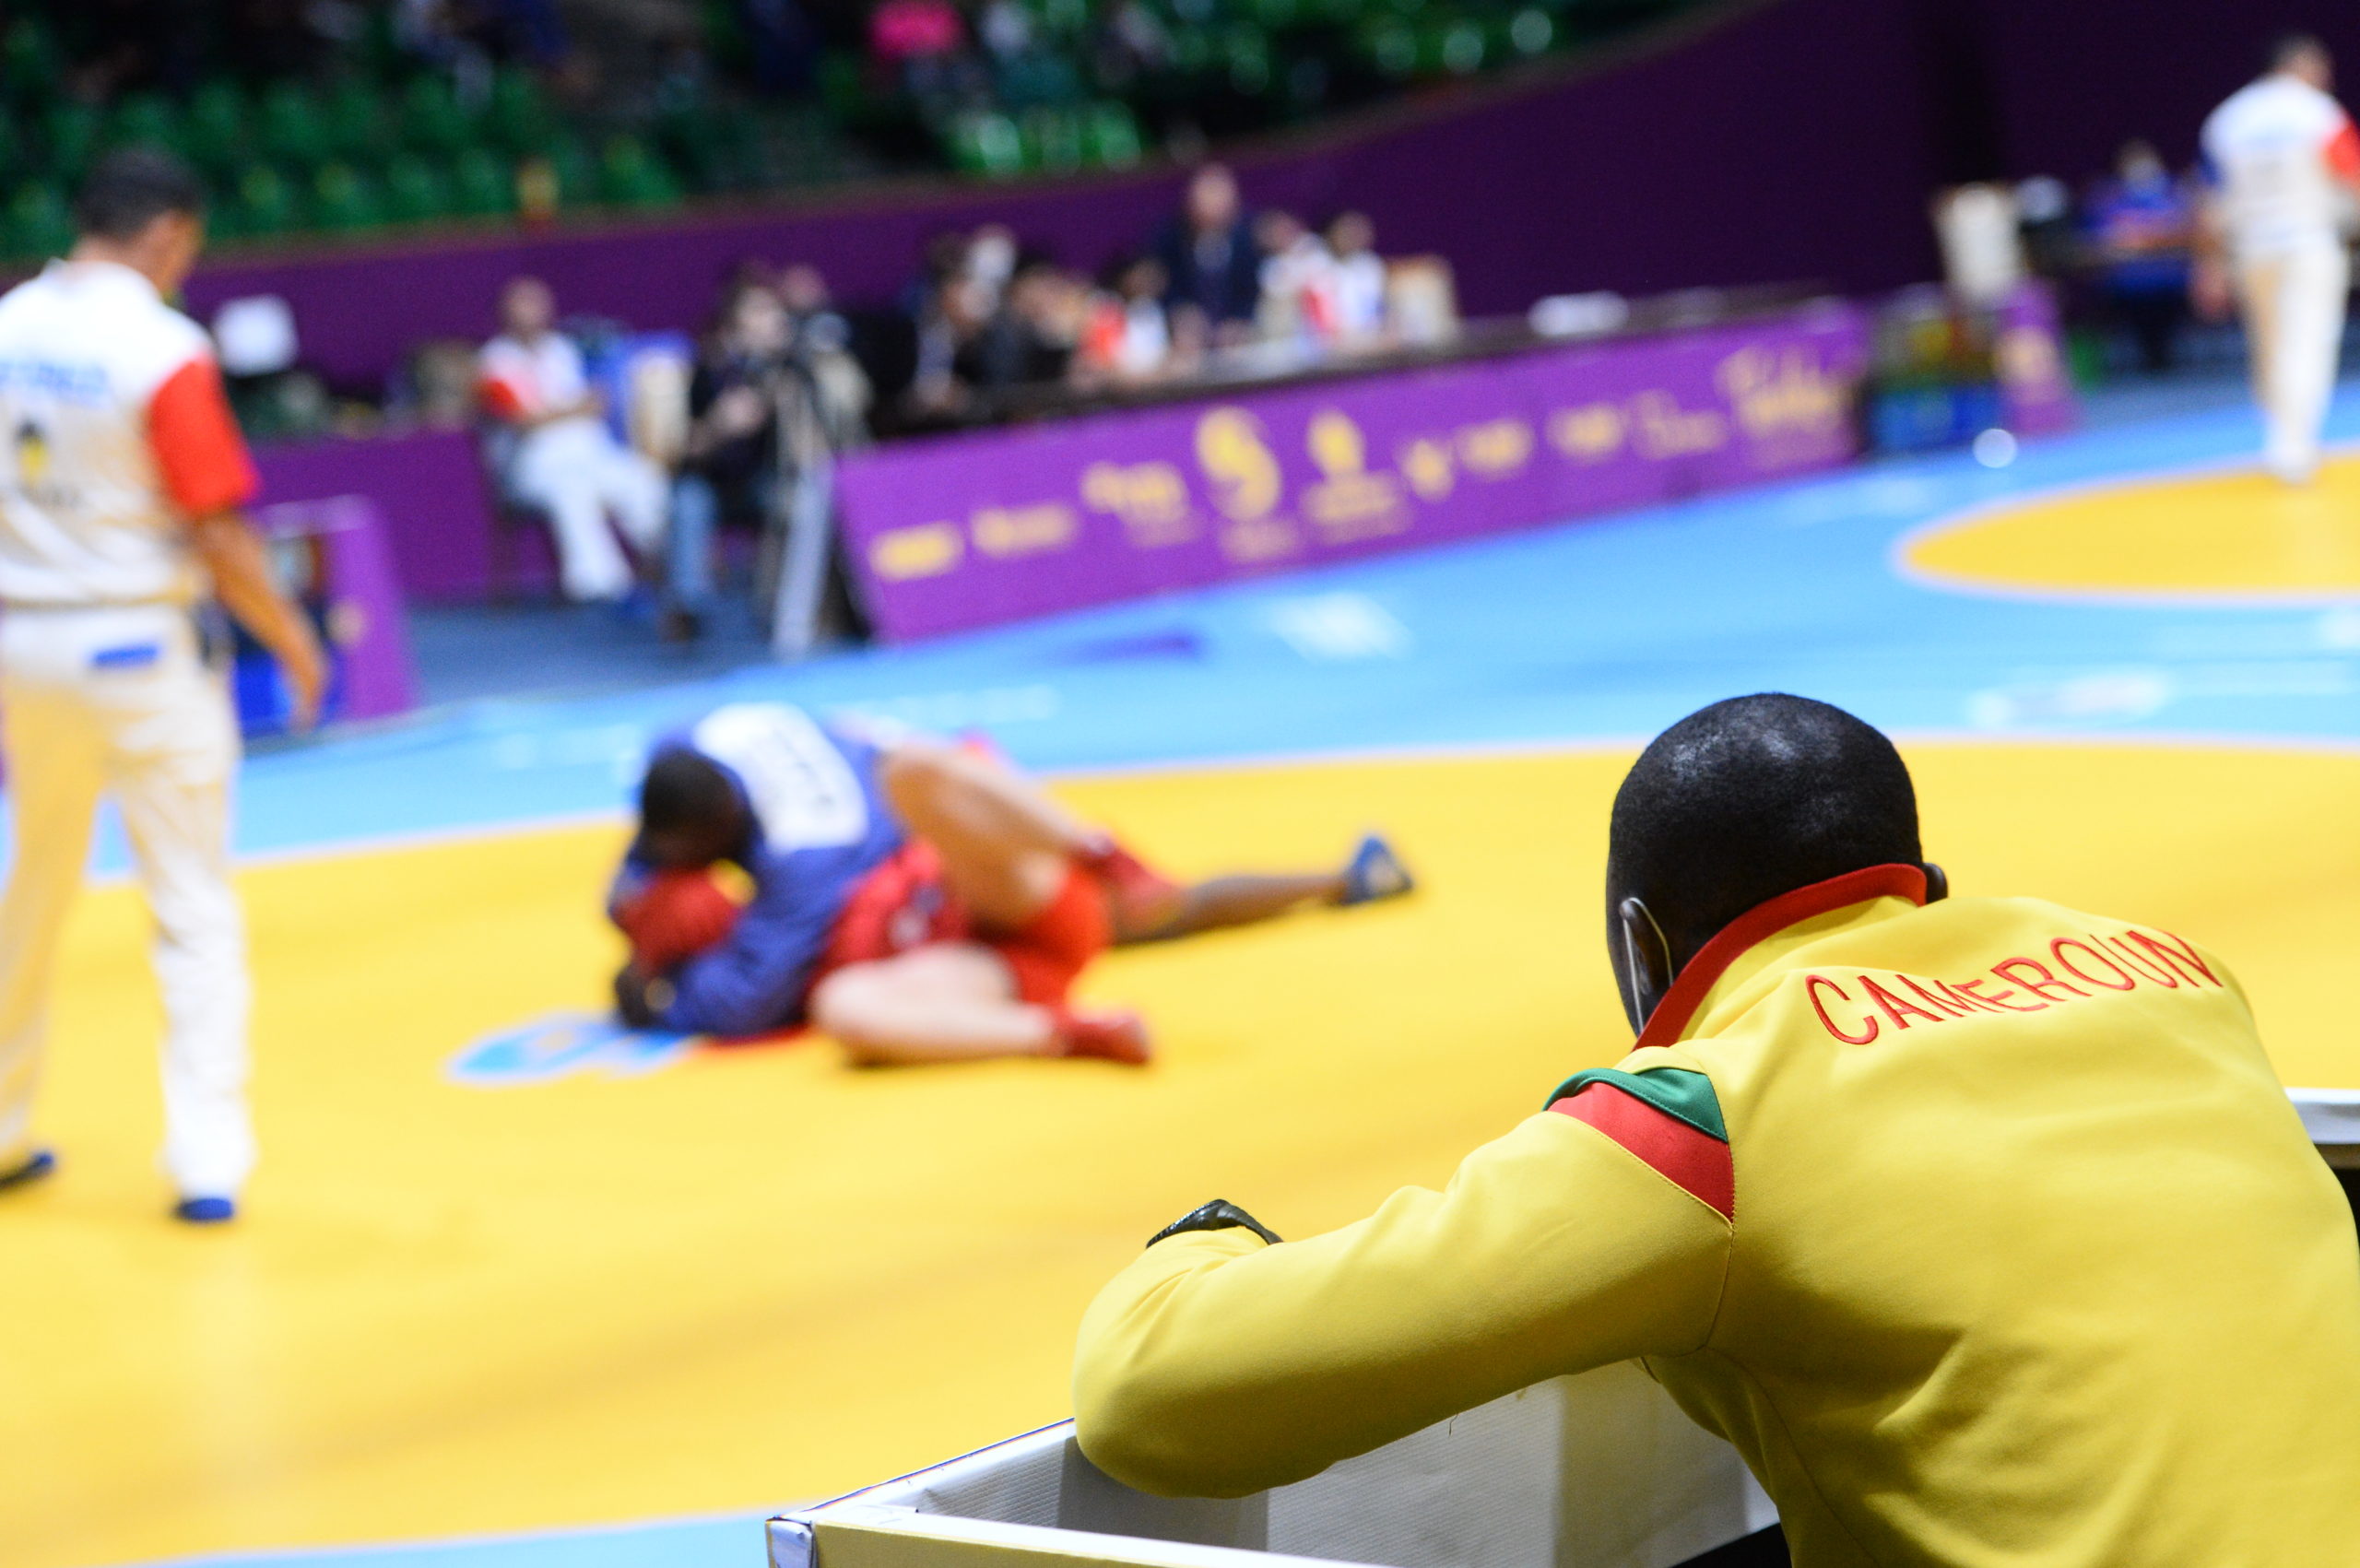
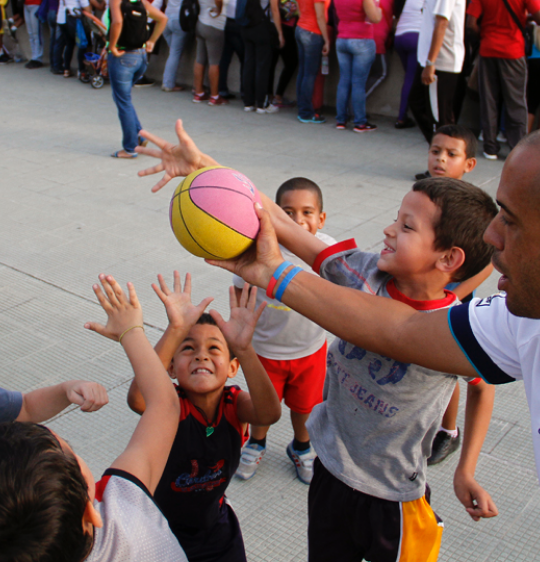
Measuring the impact of Sport for All activities is a journey of understanding. It’s about gathering the evidence to show your progress while celebrating the people whose lives have been touched by your work.
Sport for All is about creating a positive change in communities. To truly understand the value of these activities, we need to measure their impact. Evaluation isn’t just a formal process; it’s how we reflect on what we’ve achieved, learn from the challenges, and celebrate the stories that matter.
Before launching a program, identify the information you need to evaluate success. This might include baseline data on participants’ activity levels or community perceptions of inclusivity.
Leverage Technology: Use mobile apps or online platforms for surveys and registration to streamline data collection.
Promote Transparency: Share your results with stakeholders through newsletters, social media or public reports. Transparency builds trust and encourages others to get involved.
Measuring the impact of Sport for All activities is a journey of understanding. It’s about gathering the evidence to show your progress while celebrating the people whose lives have been touched by your work.
From numbers that highlight diversity to stories that inspire, evaluation tools help us see the difference we are making and plan for what’s next. Use these tools not only to build your evidence base but to tell the world: This is what sport can achieve.
For more guidance, check out the WTTD 2024 Final Report, and the Diversity and Inclusion Handbook Phase 2, which offer real-world examples to help you reflect, evaluate and grow.
Let us keep moving forward—together.
Every successful evaluation starts with clear goals. What are you trying to achieve with your program? Is it about increasing participation? Encouraging diversity? Promoting health and well-being? Once you have defined this, you can identify the data you need to collect to understand your success.
At the heart of World Table Tennis Day 2024 was a mission to make table tennis more inclusive and accessible, embodied by its theme of “Diversity and Inclusion”. The event engaged over 87,000 participants across 121 countries. Goals like these translate into measurable indicators: the gender breakdown of participants, stories of inclusion, and the reach of the event on social media. For example, the event not only balanced gender participation but also included 582 non-binary participants, ensuring representation for all identities.
Key items for Impact Measurement:
Example: In the WTTD 2024 report, diversity was a key focus, and measurable KPIs included gender identity data (42,309 female, 44,635 male, and 582 non-binary participants) and target groups like youth (59.8%) and refugees (12%).
Develop Evaluation Metrics
Key metrics should cover:
To evaluate the true impact of your program, you need a mix of quantitative data (numbers and participation rates) and qualitative insights (stories and personal experiences). Together, they provide a full picture of the difference your program is making.
Quantitative Tools
Numbers tell a powerful story: For example, during WTTD 2024, 42,309 females, 44,635 males, and 582 non-binary participants joined events worldwide, showcasing a commitment to inclusivity. Youth made up nearly 60% of participants, while programs for seniors and refugees accounted for a significant percentage. Beyond participation, data collected through platforms like the Pongmasters app allowed organisers to track infrastructure, including mapping 141 new tables globally, complete with diversity and accessibility tags.
If you’re collecting numbers for your own program, consider:
Quantitative tools such as surveys, attendance sheets, and digital platforms can make a big difference in tracking, analysing, and reporting on quantitative metrics.
While data provides valuable insights, the true essence of Sport for All is found in the voices and experiences of those involved. By engaging directly with participants, volunteers, and community leaders, we gain a deeper understanding of the social and emotional impact of our initiatives. Through interviews, focus groups, and storytelling, we highlight the powerful ways sport fosters inclusion, unity, and positive change.
While numbers are vital, they only tell part of the story. The real heart of Sport for All lies in the experiences and stories of the people involved.
To collect these stories:
The Diversity and Inclusion Handbook Phase 2 emphasises the importance of capturing these elements. Promoters who led events during World Table Tennis Day were not just organisers; they became storytellers, showcasing how sport can break barriers and build bridges.
An impact report is more than a document—it is your story of success. It highlights the achievements of your program while sharing lessons learned and plans for the future. Here’s how you can create one:
Structure of an Impact Report
Tips for a Strong Report
Evaluation is not just about measuring success; it’s about learning and improving. Collaborate with others to share insights and tools.
Celebrate your achievements but also take time to reflect. How can you deepen your impact? How can you make your activities more inclusive or sustainable?
For example, during WTTD 2024, ITTF Foundation’s focus on accessibility led to a legacy of newly mapped tables worldwide. Similarly, partnerships with local organisations helped expand the reach of their diversity and inclusion efforts, ensuring that table tennis is for everyone, everywhere.
Framing Your Goals and Gathering Insights
Collecting Data: Numbers, Stories, and Insights
Evaluating and Reporting Your Impact
For organisations and individuals involved in Sport for All, evaluation provides answers to critical questions: Are we achieving our goals? Are we reaching the people who need us most? Are we contributing to something bigger, such as the UN’s Sustainable Development Goals (SDGs)? With the right tools, we can gather evidence that tells these stories, validates our efforts, and...
Sports have the power to transform lives by fostering physical health, mental well-being and social connections. However, many individuals face significant barriers that prevent them from joining or staying involved in organised sports. These obstacles range from financial and time constraints to social and cultural factors, creating challenges that organisations must address to ensure inclusiveness and sustained engagement. This guide...
The United Nation Sustainable Development Goals (SDGs), adopted by 193 countries in 2015, serve as a global blueprint for addressing the world’s most pressing challenges by 2030. These 17 interconnected goals aim to tackle issues like poverty, inequality, climate change, and access to education and healthcare. At the heart of the SDGs are three guiding principles: People, Planet, and...
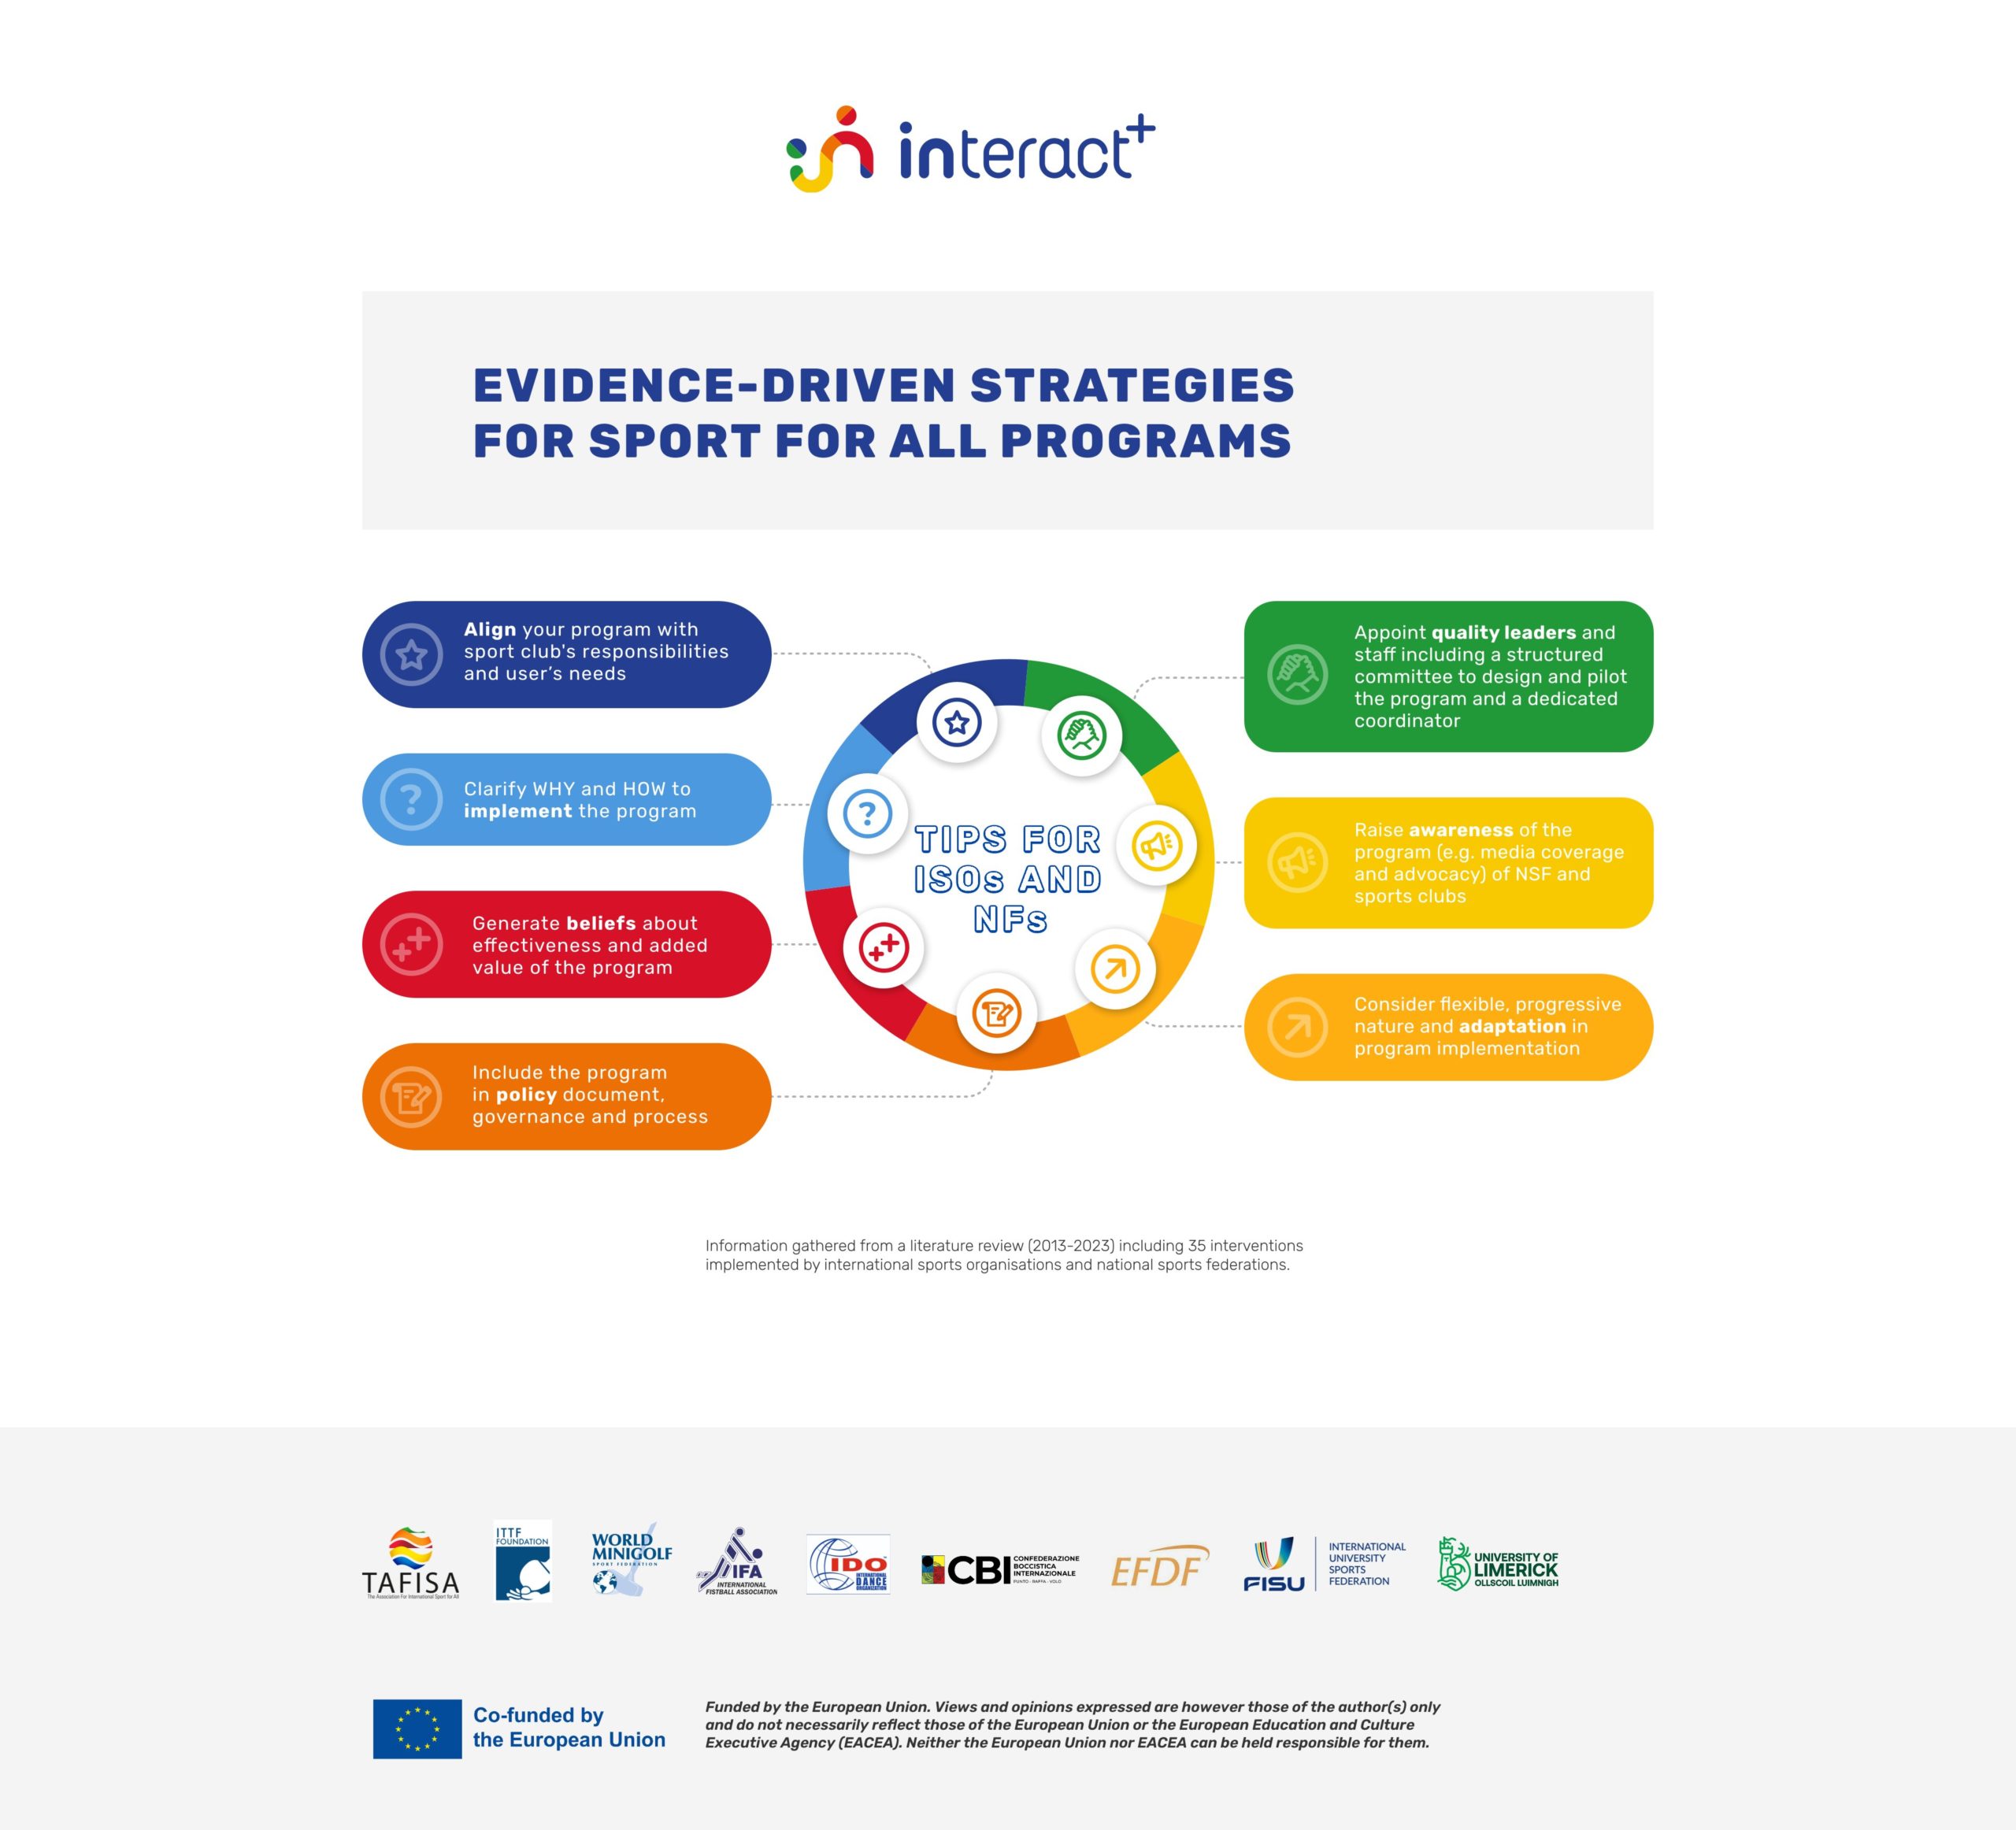
International Sports Organisations (ISOs) and National Federations (NFs) play a crucial role in shaping the future of sports participation and inclusion. However, the traditional focus on elite performance and competitive sports has often sidelined broader social, health, and community-based objectives. The INTERACT+ project aims to bridge this gap by providing ISOs and NFs with the tools and strategic direction...